Ultimate Guide to White-Label Client Reporting 2026
If I want client reporting that scales in 2026, I need four things: one branded client portal, clean KPI rules, automated report delivery, and a human review step before reports go out.
Here’s the short version:
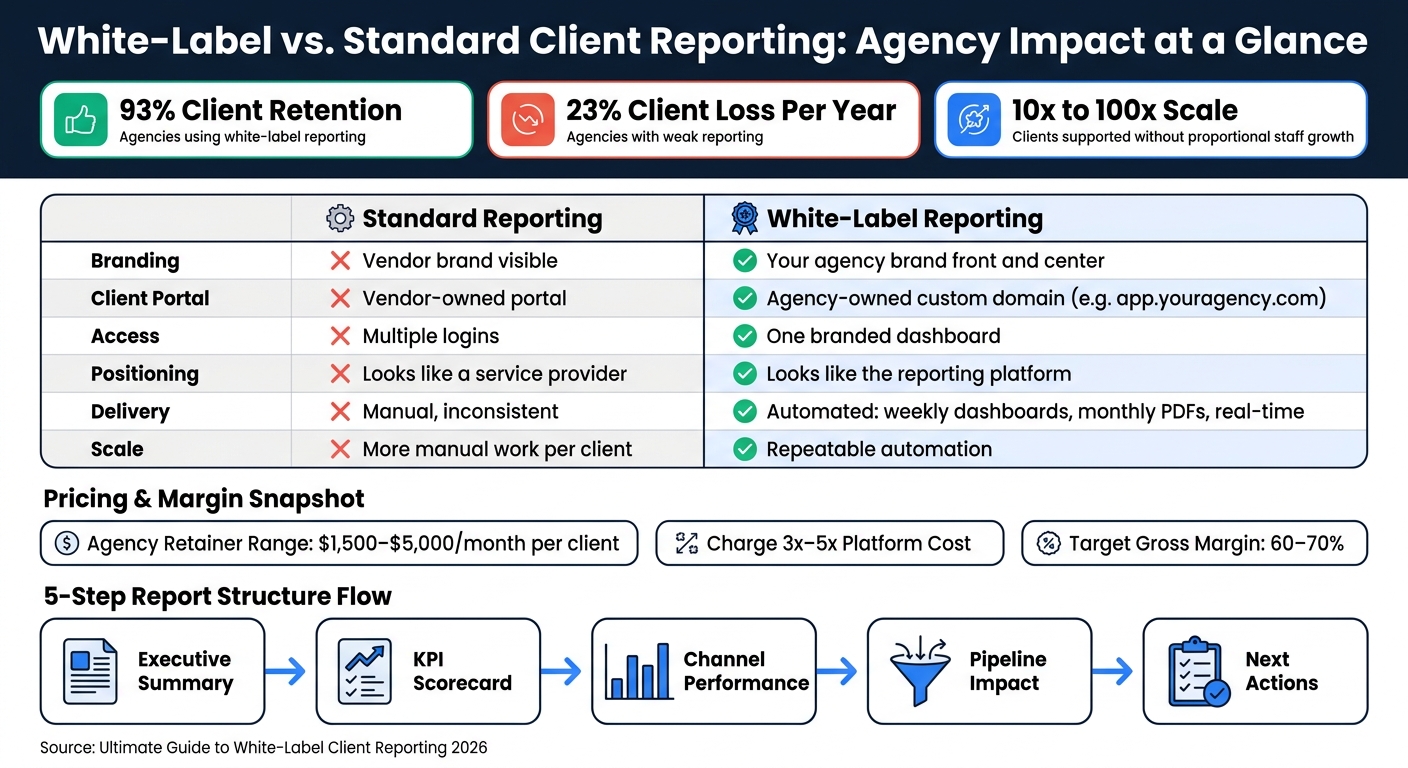
White-label reporting means clients see my brand, domain, and dashboard, not a vendor’s
It helps agencies look like the platform instead of just a tool user
The reports that matter most tie work to meetings booked, pipeline value, and revenue
Agencies often bundle reporting into retainers from $1,500 to $5,000 per month
Teams using white-label reporting have reported 93% client retention, while agencies with weak reporting can lose around 23% of clients each year
Automation can help a team support 10 to 100+ clients without adding the same amount of staff
The setup works best when I define one source of truth for each KPI before launch
Good reports need more than charts - they need short commentary on what changed, why it matters, and what happens next
Access control matters too: each client should have separate logins, separate workspaces, and clear export limits
If I strip it down even more, the article comes down to this:
Use the right data:outreach, replies, meetings, CRM pipeline, and lead quality
Brand the experience: custom domain, logo, colors, and client-only access
Automate delivery: weekly dashboards, monthly PDFs, or live views by client tier
Keep reports focused: show business results first, activity second
Set rules early: define terms like qualified lead and booked meeting before reporting starts
Check margin math: many agencies aim to charge 3x to 5x platform cost and keep 60% to 70% gross margin
Protect access: role-based permissions for admins, account managers, contractors, and clients
A simple reporting flow works best:
Executive Summary
KPI Scorecard
Channel Performance
Pipeline Impact
Next Actions
Here’s a fast side-by-side view of the main choice the article covers:
Area
Standard Reporting
White-Label Reporting
Branding
Vendor brand is visible
My brand is front and center
Client experience
Vendor portal and tool feel
Agency-owned portal feel
Access
Can involve many logins
One branded dashboard
Positioning
Agency looks like a service provider
Agency looks like the reporting platform
Scale
More manual work
More automation and repeatable delivery
The main point is simple: branded reporting is not just a design choice. It changes how clients see the agency, how reports are delivered, and how easy it is to keep accounts long term.
Below, I’d break down how to set it up, what to track, what to avoid, and how tools like SalesLabel can feed the reporting layer with outreach, reply, lead score, and meeting data.
White-Label vs. Standard Client Reporting: Agency Impact at a Glance
White-Label Reporting and Analytics for Agencies
sbb-itb-a781ab9
The Core Parts of a White-Label Reporting Stack
A white-label reporting stack has three layers: data, branding, and automation. If one of them breaks, the report starts to lose its point. Together, these layers turn raw lead-gen numbers into branded reporting that clients can rely on. For lead-generation agencies, that means turning outreach work into reporting a client can open and understand fast.
Data Sources and KPI Inputs
Reporting is only as good as the data behind it. For lead-gen agencies, the main inputs are email outreach activity, LinkedIn activity, CRM data from tools like HubSpot, Salesforce, and Pipedrive, plus pipeline metrics such as meetings booked and opportunities created. [2][3]
A simple way to organize those inputs is to sort them into three buckets:
Meetings booked, opportunities created, pipeline value, cost per lead
For most lead-gen agencies, meetings booked and pipeline created matter more than raw activity totals. Sending 10,000 emails sounds busy, but if nothing turns into sales conversations, the client won't care much.
One small move can save a lot of friction later: define "qualified lead" with each client before launch. [5] If you skip that step, your numbers and their expectations can drift apart fast.
Once the metrics are set, the next job is making the dashboard feel like it came from your agency, not from a third-party tool.
Branding and Client Access Basics
The branding layer is what makes the dashboard feel like your agency's product. Clients should log in through your domain, see your brand, and view only their own data.
That usually means setting up:
A custom domain such as app.youragency.com
Your agency logo and color palette across dashboards
Emails sent from your agency domain
A client portal with controlled login access
Most modern white-label stacks make this pretty simple. You upload brand assets, connect your domain, and set client-level permissions through a no-code interface. [3]
Automation and Narrative Layer
Once the data and brand layers are in place, automation keeps reporting current without manual effort. Automated refreshes pull in updated metrics on a set schedule, while scheduled delivery keeps clients in the loop with weekly performance updates and monthly strategy reviews. [2]
Then comes the narrative layer. This is the part that turns a wall of metrics into something a client can scan and get. AI can draft short performance summaries automatically. [5]
That setup gives each client the level of access that fits their account without forcing your team to build a different process every time.
How to Set Up White-Label Client Reporting Step by Step
Once your stack is set, the next move is turning it into a launch workflow. A structured launch process helps cut rework and speed up deployment [4].
Prepare Your Brand Kit and Reporting Standards
Start by pulling your brand assets into one place: high-resolution logos, hex color codes, and branded email templates. Then set up a custom subdomain, like outreach.youragency.com, and point it to your provider.
Keep your reporting standards tight from day one. Use USD and MM/DD/YYYY in every report. It also helps to assign clear ownership early:
One person handles setup
One person reviews everything before launch
That simple handoff can save a lot of back-and-forth later.
Build Templates and Delivery Workflows
Vertical-specific templates can shorten launch time [4]. Build each one around the metrics clients care about most: outreach, replies, meetings booked, and pipeline value.
The structure should focus on meetings booked and pipeline created. From there, map each template to both activity and pipeline metrics. Then set the delivery cadence by client tier, so reports go out on schedule without manual work each time.
Create a Review Process That Scales
Before each delivery, run a light QA pass to catch data issues without bogging down the workflow. Have account managers check each report against the source data.
It’s a small step, but it matters. A fast review helps protect report credibility before clients open the dashboard.
The table below shows a phased launch timeline that keeps the process moving [4]:
Team training, client onboarding workflow, reporting dashboard activation
With the workflow live, the next step is shaping the report structure clients will actually read.
How to Design White-Label Reports Clients Actually Value
Once the data is flowing, the report needs to do more than show numbers. It needs to help clients make decisions. A good report ties your agency’s work to business results.
The Right Report Structure for Lead-Gen Agencies
Every high-value report should follow the same flow: Executive Summary, KPI Scorecard, Channel Performance, Pipeline Impact, and Next Actions.
That sequence matters. Clients read from the top down, so start with the wins before you get into the data.
The Executive Summary should be short - about three to four sentences. It should explain what happened, what it means, and what comes next. The KPI Scorecard puts the most important numbers front and center. Channel Performance shows results by platform. Pipeline Impact turns activity into USD value. And Next Actions closes the loop with clear recommendations, so clients know exactly what your agency plans to do with the data.
Metrics That Matter to U.S. Clients
Keep the focus on metrics tied to revenue. That’s what clients care about most.
Metric Category
Key KPIs
Purpose in Report
Revenue Impact
Meetings Booked, Qualified Leads, Pipeline Value (USD), Attributed Revenue
Proves ROI and justifies the agency retainer
Efficiency
Cost Per Lead (CPL), Cost Per Meeting
Shows scalability and spend effectiveness
Engagement
Positive Reply Rate, Intent Classification
Shows lead quality and buying intent
Operational
Outreach Volume, Connection Rate, Email Opens
Useful internally for A/B testing and targeting
One small detail can save a lot of confusion: use the agreed definition of a qualified lead in the scorecard every month. If that definition keeps shifting, the report gets muddy fast.
Using AI to Improve Reporting Without Losing Agency Ownership
AI can handle the first draft, but your agency should still own the thinking.
It can pull data together, spot patterns, and draft summaries. But the meaning behind those numbers still comes from your team. That’s where clients see your worth.
A simple way to think about it: AI shows the what. Your agency explains the why and what to do next. Recommendations, messaging shifts, and targeting choices should stay in human hands.
Using SalesLabel to Power Branded Lead-Generation Reporting
What SalesLabel Adds to the Reporting Workflow
AI summaries tell the story. SalesLabel supplies the workflow data behind that story.
It gives agencies a clearer view of outreach execution across sourcing, enrichment, personalized outreach, follow-up automation, reply handling, meeting booking, and real-time lead scoring.
That means clients can see the full chain, from leads sourced all the way to meetings booked. The parts that feed reports most directly are real-time lead scoring, reply handling, inbox status, and meeting-booking visibility. Lead scores show prospect quality. Reply classification turns raw inbox activity into something a client can read fast and use right away.
Still, raw data alone won't help much. It needs to be shaped into a clean reporting structure.
How Agencies Can Turn SalesLabel Data Into Client Reports
A simple way to organize SalesLabel data is to split it into three layers: activity, response, and outcome. Those layers line up with the report structure introduced earlier. Activity supports the KPI Scorecard. Response feeds the Channel Performance section. Outcome drives the Pipeline Impact and Next Actions blocks.
Meetings booked, qualified leads, pipeline value (USD)
Direct connection to revenue
From there, package the report as an agency deliverable and add a short commentary block that explains what changed, what the numbers mean, and what happens next.
With the report structure in place, the next call is cost and scale.
Budgeting for Scale
SalesLabel’s pricing gives agencies a clear starting point for costs. The Starter plan is $799/month and supports up to 30 LinkedIn accounts. Growth is $1,279/month and supports up to 99 accounts. Scale is $1,999/month with unlimited accounts [6][7].
For agencies running white-label lead-gen services, those tiers can support strong recurring margins. The practical move is to match the plan to client count and reporting cadence. Once volume lines up with the right plan, the bigger issue usually becomes data quality, not software cost.
Common Problems and How to Fix Them
Even solid reporting setups tend to break in the same three places: data mismatches, generic-looking reports, and too many metrics.
Data Mismatches Across Platforms
The most common problem is simple: the numbers don’t match from one system to another.
The fix is to set source-of-truth rules before reporting begins. Pick one source of truth for each KPI. For example, use the sending platform for outreach data, and the CRM for meetings and pipeline. Put those rules in writing, ideally in the client contract [5].
You also need one shared definition for terms like positive reply, qualified lead, and booked meeting before the first report goes out. If your team and the client use different meanings, trust can slip fast. A shared definition keeps everyone on the same page and makes the report easier to stand behind.
Once the numbers line up, there’s another problem to deal with: context.
Reports That Look Branded but Feel Generic
A report with your logo on it may look polished. But that doesn’t make it a branded report in any meaningful sense.
If the report is just a dashboard export with no explanation, the client is basically staring at raw data and trying to make sense of it alone. That’s data, not reporting.
What gives the report value is your commentary. The client needs to know what changed, why it matters, and what to do next. And branded reports should focus on pipeline metrics, not just activity counts [2].
After that, the next step is to trim the report down.
Too Many Metrics, Not Enough Meaning
More charts don’t make a report better. They usually make it harder to read.
Tie every report to the metrics that link straight to business outcomes. If a metric doesn’t affect revenue, pipeline, or a decision, cut it. That keeps the report centered on decision support instead of turning it into a screen full of numbers [2][5].
White-Label Reporting Tools: What to Check Before You Choose
Once you’ve nailed down the report format, the next step is picking a tool that can deliver it week after week without drama. A poor fit doesn’t just slow things down. It also adds more upkeep as your client list grows. So when you compare options, look closely at access control, branding, integrations, and total cost.
Must-Have Features for Agency Use
Start with the basics that matter for agency work: role-based access, secure client portals, custom branding, and native integrations with HubSpot, Salesforce, or Pipedrive [2][3][6]. Those aren’t nice extras. They shape whether you can give clients a branded reporting experience without exposing the tech stack behind it.
All-in-One vs. Modular Setups: Pros and Cons
All-in-one tools make it easier to keep reporting and branding aligned. Modular setups can work too, but they usually take more effort to keep the client experience clean and consistent.
For most agencies, the all-in-one route is the simpler choice. You get fewer moving parts, less back-and-forth, and a smoother client-facing setup. A modular stack makes more sense if you need custom data flows and have the time to manage the added integration work. Once the platform matches your workflow, lock down permissions and export rules before you roll it out to clients.
How to Estimate Cost by Client Count and Service Line
After product fit, the math has to work too. A reporting tool might look fine at five clients and feel painful at 50.
Aim for a 60–70% gross margin on the service [5]. In plain terms, if your white-label platform costs $X per client, you’ll usually want to charge at least 3x to 5x that amount. That gives you room to cover consulting, optimization labor, and reporting overhead [5].
A few pricing rules help here:
Avoid per-seat pricing models. They punish growth.
Flat monthly tiers are easier to budget as you scale.
Build packages around tiered service levels so clients have a clear upgrade path as lead volume grows [2][5].
That last part matters more than it seems. If pricing is simple, sales gets easier, forecasting gets cleaner, and account growth feels a lot less messy.
Security, Permissions, and Client Access Rules
Once your reporting workflow is in place, the next step is simple: decide who can view, edit, and export data. That’s what keeps client data safe and stops one workspace from bleeding into another.
You want clear rules from day one. Who can see what? Who can change what? And if someone leaves your team, how fast can you shut off access? Those answers shouldn’t be left to guesswork.
Set Role-Based Permissions
Match each permission level to the person’s actual job. A simple ladder works well: admin, manager, contributor, viewer.
User Role
Access Level
Key Responsibilities
Agency Admin
Full Platform
Branding, billing, user management, and global settings
Account Manager
Workspace Level
Managing specific client campaigns and reviewing reports
SDR / Contractor
Limited Task Access
Lead sourcing, enrichment, and outreach execution
Client Viewer
Viewer Level
Tracking leads, replies, and meetings via branded dashboard
This setup cuts down on handoff errors and limits sensitive account data to the people who actually need it. On top of that, centralized admin controls make it easy to revoke and reassign access right away [2].
Use Secure Domains and Login Controls
Set up an SSL-enabled subdomain like app.youragency.com for client report access [1][3]. It gives you a cleaner setup and adds a layer of protection around logins.
When you first configure it, plan for 24–48 hours of DNS propagation time [2]. You should also keep billing and account ownership under one admin dashboard. That way, if an account manager leaves, you can reassign workspaces and remove access without disrupting service [2].
Control What Clients Can See and Export
Client access should stay separate from internal access. Give each client their own login and workspace [2]. That one move helps block cross-account access.
If you sell different service tiers, tie reporting access to the plan each client has purchased. Lower tiers should see less detail, while higher tiers can open up more reporting depth [5]. It’s a clean way to match visibility to the service level without exposing extra data.
Conclusion: Build a Reporting System That Scales With Your Agency
After security and access rules, the last step is making your reporting system hold up as your agency grows. At scale, that system comes down to four parts: brand consistency, clear KPIs, automation, and human oversight.
Structured onboarding helps agencies launch 3x faster and retain 2.4x more clients in year one [4].
Automation takes care of reporting volume. Your team handles the meaning behind the numbers: interpretation, trends, and next steps.
SalesLabel runs the data layer, while your team owns the strategy, optimization, and client guidance. Its outputs feed client dashboards with the metrics that matter most: lead scores, replies, and meetings booked. That’s how reporting stops being a monthly chore and starts becoming an agency asset. Build it once, then scale it as your client base grows.
FAQs
How do I define KPIs before launch?
Focus on KPIs that show clear client value, like outreach volume, response rates, and total meetings booked. Tie those metrics to your ideal customer profile (ICP) so your target list and campaign plan stay in sync.
Set these benchmarks early, and your reports will show your agency’s value in a way that goes beyond raw lead counts. SalesLabel can automate data collection and keep your insights clear and easy to report from day one.
What should go in a white-label client report?
A strong white-label client report should focus on the numbers clients care about most: clear value and campaign progress.
That usually means showing metrics like:
leads generated
replies received
meetings booked
With SalesLabel, agencies can show this data in a fully branded, client-facing dashboard that keeps their own identity front and center while giving clients clear proof of performance.
How can I scale reporting without losing quality?
Make reporting systematic and automated.
A white-label dashboard gives clients a clear view of the KPIs they care about most, like opens, replies, meetings, and pipeline. That means they can check performance without digging through manual spreadsheets or waiting for one-off updates.
Use weekly updates to keep momentum up, then use monthly or quarterly reviews to adjust targeting, messaging, and channel mix based on what the numbers show.
It also helps to agree on success from day one. For example, define what counts as a lead so your team and the client are working from the same playbook.
To match effort with usage, offer tiered reporting and optimization. That way, accounts that need more support get it, while lighter-use clients still get a clean, useful reporting setup.
SalesLabel supports branded client dashboards and recurring reporting.