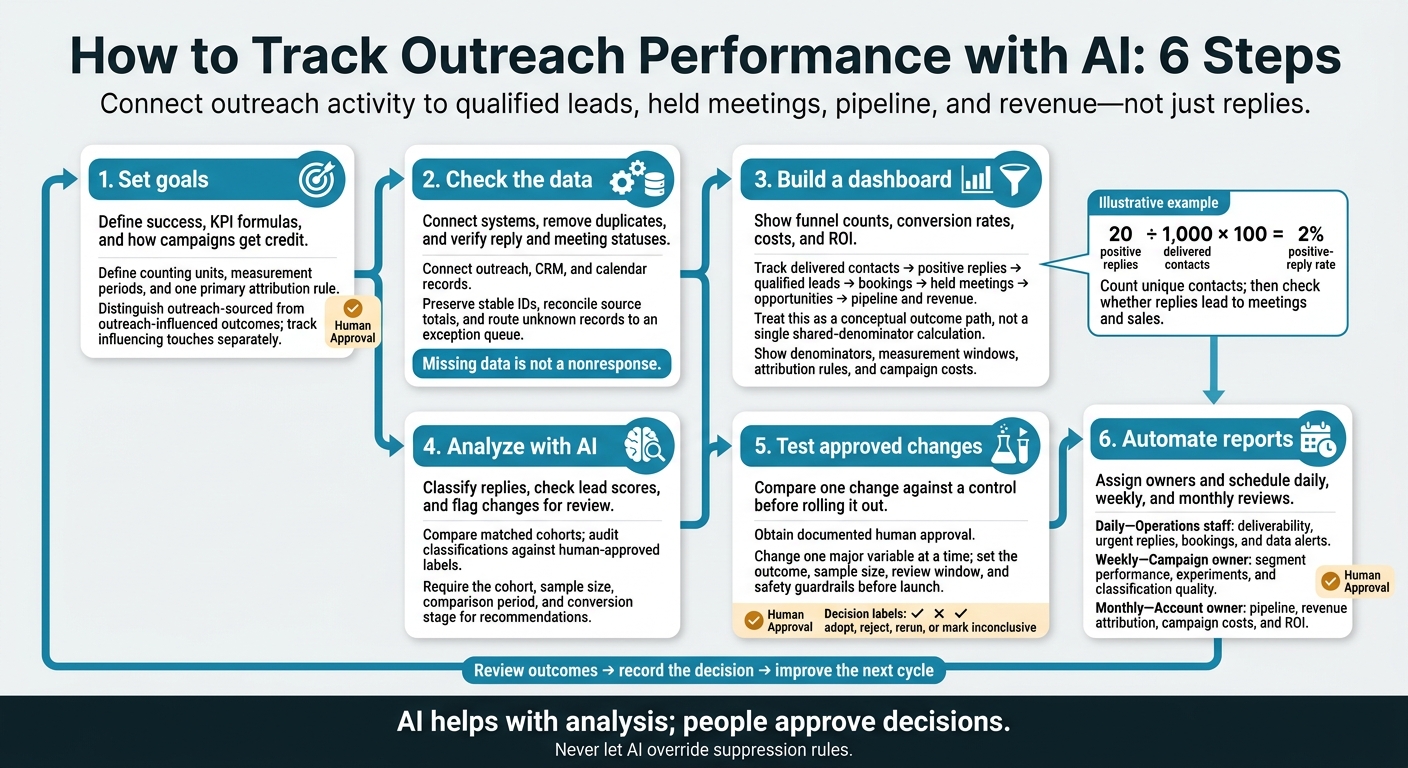
I track outreach with AI by linking messages to qualified leads, held meetings, pipeline, and revenue - not just replies. First, I connect outreach, CRM, and calendar records and set clear counting and attribution rules.
My process has six steps:
Set goals: Define success, KPI formulas, and how campaigns get credit.
Check the data: Connect systems, remove duplicates, and verify reply and meeting statuses.
Build a dashboard: Show funnel counts, conversion rates, costs, and ROI.
Analyze with AI: Classify replies, check lead scores, and flag changes for review.
Test approved changes: Compare one change against a control before rolling it out.
Automate reports: Assign owners and schedule daily, weekly, and monthly reviews.
For example, 20 positive replies from 1,000 delivered contacts gives me a 2% positive-reply rate. But I still check whether those replies led to meetings and sales.
My rule: <u>AI helps with analysis; people approve decisions.</u> That keeps reporting focused on business results, not inbox activity.
How to Track Outreach Performance with AI: 6 Steps
Step 1: Set Goals and Measurement Rules
Define how AI will measure outreach performance before launch. Record the client’s objective, audience, scope, success criteria, reporting owner, and measurement period. These rules guide how AI scores, classifies, and reports every result.
Check sender health, domain authentication, active suppression and opt-out lists, CRM synchronization, and calendar-event tracking. Log any missing opportunity values or attendance data. Don’t let AI fill in the gaps.
Choose KPIs and Define How to Count Them
Group KPIs into activity, engagement, conversion, and revenue. Base targets on comparable campaign history - not generic industry averages. If records are incomplete, mark targets as provisional.
Define positive replies as buying interest, qualified leads by fit and intent, and held meetings by verified attendance.
Document each metric’s unit and formula so AI counts results consistently:
Sends and deliveries: Count messages.
Positive replies, qualified leads, and opt-outs: Count unique contacts.
Bookings and held meetings: Count meetings.
Pipeline: Count unique CRM opportunities.
Positive reply rate = unique positive repliers ÷ unique delivered contacts × 100. Specify whether each contact counts once per campaign or once per reporting period.
Use the client’s time zone for all reporting. Report sends by send date, leads by created date, bookings by booked date, and held meetings by meeting date. Report opportunities and revenue by stage or close date. Then connect each metric to the campaign fields that will record it.
Set Attribution Rules and Campaign Fields
Map each metric to the fields needed to track every touch and outcome. Require:
Campaign and audience: Client and campaign IDs, touchpoint ID, target segment, and contact and account IDs.
Message and sender: Channel, sequence step, message variant, sender or owner, and sending account.
Timing and source: Send timestamp, time zone, and CRM source.
Status and results: Suppression status, reply classification, meeting status, opportunity ID, and outcome.
Link classifications, statuses, and opportunity IDs as they become available. Keep variant IDs when AI revises copy so you can trace results back to each version.
Choose and document one primary crediting rule. Outreach-sourced means outreach created the opportunity. Outreach-influenced means it helped move an existing opportunity forward.
Assign one primary source per outcome so AI can trace each meeting and opportunity to a single campaign. Track influencing touches separately.
Set attribution windows as policy choices, measured from the last eligible touch.
For example, allow 30 days for meetings and 90 days for opportunity creation.
Have a human approve these rules before AI applies them.
sbb-itb-a781ab9
Step 2: Connect and Check Outreach Data
Connect lead sourcing, enrichment, delivery, replies, qualification, bookings, CRM updates, and revenue using native integrations, authenticated APIs, or scheduled exports. Check that every source field reaches the reporting schema. Add a source system field so you can tell imported records apart from records created in the CRM.
Sync hard bounces, unsubscribes, spam complaints, and positive replies in near real time. Reconcile enrichment, CRM updates, and revenue daily, and check data completeness weekly. Track both event time and arrival time to spot delays. These checks help keep the Step 3 dashboard aligned with source data.
Match Lead Records and Label Outcomes
Use one stable lead ID across every system, plus separate IDs for campaigns and interactions. Match duplicates using CRM IDs, normalized email addresses, and company domains - not email alone. When merging contacts, preserve their messages, replies, meetings, and timestamps. Log each merge and the rules used to decide which field values to keep.
Give each outcome its own label: invalid address, hard bounce, soft bounce, unsubscribe, spam complaint, out-of-office message, negative reply, or nonresponse. Missing data is not a nonresponse. Map source labels to controlled values, and retain the original labels alongside AI classifications and human corrections.
Put unknown records in an exception queue. Missing replies can understate conversions, while inconsistent labels can skew AI analysis.
Check Data Quality and Client Access
After every sync, check for missing statuses, reply labels, meeting outcomes, sequence names, campaign sources, CRM mappings, and timestamps. Reconcile source totals against imported records. Show the last successful sync and the number of rejected records.
Store normalized timestamps alongside the original times, and label time zones when displaying dates. Timestamp errors, sync delays, and rejected records can skew funnel metrics and revenue reports.
Before reporting, test that unsubscribes stop scheduled sends and that meeting cancellations reach the CRM. Do not retry hard bounces. These checks prepare the data for the funnel metrics in Step 3.
Give analysts read-only access. Allow only designated operators to change campaigns and suppression settings. Restrict clients to their own records, give AI access only to required fields, and log exports and deletion deadlines.
Step 3: Build an Outreach Funnel Dashboard
Once your records are matched and validated, build a dashboard that tracks counts and conversion rates from delivery through revenue. Count distinct contacts for person-level rates so multiple messages to one person don’t count as multiple prospects. Apply the Step 1 definitions for positive replies and qualified leads.
Show the denominator and measurement window beside every percentage. For contact-level reply, positive-reply, and booking rates, divide by distinct delivered contacts: people who received at least one delivered email.
When a channel lacks reliable delivery data, label its denominator clearly. That might mean distinct contacts messaged, connection requests accepted, or calls completed. Don’t compare rates as if those bases were the same.
Metric
Formula
Interpretation risk
Delivery rate
Delivered messages ÷ sent messages × 100
Delivery does not prove the recipient saw or read the message
Bounce rate
Bounced messages ÷ sent messages × 100
One contact may generate multiple message-level bounces
For attendance calculations, use bookings whose meeting time has passed. Show pending, canceled, rescheduled, and no-show statuses separately. Display the attribution model and window beside pipeline and revenue, and state whether campaign costs include labor, software, and delivery costs.[3][5]
Use Filters to Find Funnel Drop-Offs
Add filters for client, audience, industry, job title, channel, sending account, sequence step, message variant, and date range. Compare matching cohorts - not a mature campaign against one that just launched.
For example, compare contacts added during the same week and measured through the same sequence window.
Show cohort sizes and conversion delays. Otherwise, a new campaign may look weaker simply because its outcomes are still pending.
Look beyond reply volume to see where results fall short:
High delivery, low replies: Messages may lack relevance.
Healthy replies, low positive replies: Targeting may be off.
Positive replies, low bookings: Scheduling may be getting in the way.
Bookings, low held meetings: Reminders may be weak, or the meetings may be a poor fit.
A message variant with fewer replies may still deliver more qualified leads, held meetings, opportunities, or pipeline. Require every AI recommendation to name its cohort, sample size, comparison period, and conversion stage.
Use these filters to isolate drop-offs before AI analyzes patterns in Step 4.
Step 4: Use AI to Analyze Performance
With your funnel dashboard in place, use AI to explain what’s driving performance changes. Supply the cleaned dataset, approved metric dictionary, and reporting window. Stick to the approved formulas and compare like-for-like weekly or monthly cohorts. When follow-up cohorts span reporting periods, group them by campaign start date.
Classify Replies and Validate Lead Scores
Use one controlled set of reply labels: positive intent, objection/not now, referral, information request, unsubscribe, out-of-office, automated response, negative response, or wrong-person response.
Store the original message, classification, confidence score, timestamp, and routing decision. Send unclear replies to a human reviewer, and never let AI override suppression rules. Each week, audit classifications against human-approved labels. Check precision and recall for every category - not just overall accuracy - with extra attention to missed unsubscribes and false positive-intent labels.[7][8]
After routing replies, test whether lead scores predict outcomes using the same dataset. Keep these score components separate: firmographic fit, engagement, intent, CRM stage, and behavioral data. Subtract points for hard bounces, unsubscribes, invalid roles, and disqualifying firmographics.
Use only data available at send time. Then check whether higher score bands outperform lower bands over 30 or 60 days.
Find Patterns and Flag Performance Changes
Once scoring is calibrated, ask AI to look for campaign patterns behind the results. Compare message length, personalization, offer, industry, seniority, channel, and sequence step. Treat observations as hypotheses, not proven causes. Require possible explanations, such as differences in audience mix or senders.
Set alert rules before analysis.
For example, flag a bounce rate above 3% or a 30% week-over-week decline in qualified replies, while also requiring a minimum denominator such as 100 delivered messages.[6]
Require minimum volumes, then compare results with a trailing baseline, matched prior cohorts, and expected seasonality.
Before approving an action, require every recommendation to state its segment, period, metric, comparison, sample size, change, limitation, action, owner, and validation plan.
Check the numerator and denominator against outreach, CRM, and calendar records. Remove duplicates and confirm that the finding follows approved definitions. What looks like a performance problem may be a reporting problem.
Step 5: Test Changes with Human Approval
When AI flags a likely driver, test the change before rolling it out. First, get documented human approval for targeting, claims, pricing, compliance-sensitive language, studies">customer-data use, and automated replies. Name the approver and record any conditions. For agency campaigns, retain client approval for brand-sensitive changes. Before launch, confirm that someone can pause sending, route replies manually, and restore the approved campaign.
That approval is the basis for a controlled test - not broad campaign edits.
Run Controlled Tests and Record Results
Change one major variable at a time, such as the opening sentence, call to action, or follow-up interval. Write one falsifiable hypothesis tied to one outcome. Randomly assign comparable leads where practical, and use the current approved campaign as the control. Balance groups by relevant audience characteristics. Exclude suppressed contacts, duplicates, and leads already in another active experiment.
Before sending, set the primary outcome, minimum sample size, and review window. Measure qualified replies, booked meetings, opportunities, or pipeline dollars - not opens. Estimate the sample size using the baseline rate and the smallest worthwhile improvement. 95% confidence and 80% power are standard planning targets, not guarantees.[9][10] Allow 14 days after the final follow-up for reply outcomes, or 30–60 days for opportunity outcomes. Set guardrails for complaints, opt-outs, bounces, negative replies, and compliance incidents.
Don't stop early just because results look statistically significant. Repeated checks and early stopping increase false positives.[10][13] Pause immediately for safety issues, such as misleading claims or harmful automated replies. Otherwise, complete the planned sample size and review window. Mark the result inconclusive if the evidence is weak.
Keep an experiment log with the launch date and time zone, scope, hypothesis, exact change, owner, approver, and affected metric. Include group allocation, sample target, review window, model version, and any prompt or rule changes.[11][12]
Roll out an approved winner gradually, with a named owner checking downstream meeting and opportunity quality. Save counts, rates, uncertainty, guardrail outcomes, and the final decision: adopt, reject, rerun, or mark inconclusive. Feed approved results into the reporting cadence in Step 6.
Step 6: Automate Reports and Set Review Schedules
After testing, automate reporting so AI-generated insights feed regular reviews - not one-off analyses. First, check reporting views, integrations, exports, alerts, and notification paths. If you use SalesLabel, connect sourcing and enrichment to lead volume, outreach to delivered contacts, AI replies and scoring to intent and qualification, and bookings to conversion.[14][1]
Before automation, define who owns each KPI, where its data comes from, how often it updates, and which attribution rules and alert thresholds apply. Set daily, weekly, and monthly reviews. Add alerts for missing campaign IDs, duplicates, sync failures, stale records, impossible conversion rates, and sudden volume shifts. Set thresholds for each campaign and regularly check reports against source systems. Require human approval for client reports and any AI recommendation that changes targeting, messaging, budget, or routing.[17][18]
Use these same metrics in client-ready views.
Create Agency-Branded Client Reports
Check whether branded reporting is built in or requires an external tool. Verify client permissions and export options before promising a delivery format.[14][1] Keep the main view focused on 6–10 KPIs, with trend comparisons and results by segment. Match the dashboard’s attribution window and KPI definitions.[17][18]
Judge inbox activity by intent, bookings, and opportunities - not reply volume alone. Summarize the reply mix, flag human corrections, and track classification accuracy over time.[15][16]
Use the dashboard to guide reviews on a set schedule.
Assign Daily, Weekly, and Monthly Reviews
Every alert that calls for action should show its trigger, affected lead or campaign, owner, required action, deadline, and status.[17][18]
Daily - Operations staff: Check deliverability warnings, urgent replies, high-intent leads, booking failures, calendar errors, and data alerts that affect reported results. Respond to high-intent replies within 1 business hour, address booking failures the same day, and resolve sync errors within 1 business day.
Monthly - Account owner: Reconcile pipeline, revenue attribution, campaign costs, and ROI before recommending whether to scale, maintain, revise, or pause campaigns.[17][18]
Conclusion: Turn Reports into Action
After analysis and testing, turn AI findings into decisions using the same KPI definitions, attribution rules, and data checks. Let AI classify replies, spot patterns, and flag changes. Then have a human review the results.
End each cycle with a clear decision: stop what misses thresholds, continue what meets quality and cost targets, or test one approved change next. Record the decision in the campaign log, along with the evidence, owner, deadline, expected impact, and success metric.
At the next review, check whether the action worked before making another change. Compare matching periods and audience segments. Account for sample size and campaign differences so outliers don’t skew the decision.
FAQs
How can I use AI to track low-volume outreach?
Focus on high-quality signals, not activity volume. Use AI to sort replies by intent, such as interest, meeting requests, or objections. Track reply rate, sentiment, and meeting-booked rate. Send high-intent responses to a human within 2 business hours.
SalesLabel automates reporting, intent classification, and lead scoring under your branding. Spot-check AI-handled threads weekly to keep human oversight in place - without the large samples needed for high-volume A/B testing.
How do I measure ROI with long sales cycles?
Focus on pipeline metrics tied to revenue, not activity volume. Track pipeline velocity to link outreach to revenue forecasts:
Pipeline Velocity = (Qualified Opportunities × Average Deal Value × Win Rate) ÷ Sales Cycle Length
Monitor qualified pipeline value, closed-won revenue, and cost per acquisition. SalesLabel brings analytics into one place, letting you track stage movement and conversion rates to see where leads move forward - or stall - over time.
What should I do when AI misclassifies replies?
Let your team override AI labels before they trigger automated follow-ups. Manual corrections keep workflows accurate and prevent mismatched outreach. Send exceptions, such as complex budget or timeline questions, to a human representative right away.
Each week, spot-check 5% to 10% of AI-handled threads to track classification accuracy and improve AI performance over time.