Checklist-driven guide to build accurate, branded white‑label reports: KPI governance, data mapping, templates, delivery, security, and QA.
SalesLabel Team
Growth Expert • 6.11.2026
Share:
Szukasz gotowego rozwiązania?
SalesLabel automatyzuje prospecting od początku do końca — AI znajduje potencjalnych klientów, wysyła spersonalizowane wiadomości i rezerwuje spotkania pod Twoją marką.
I start white-label reporting with 5–10 client-approved KPIs - not a logo. Before building a template, I define what each metric means, where its data comes from, and who checks it. Then I set delivery dates, recipients, and approval rules.
My checklist covers five areas:
Data: Separate activity from results, check totals, and never treat missing data as zero.
Branding: Check templates, domains, sender addresses, and client-facing messages.
Delivery: Automate routine steps, but hold reports until required checks and human approval are complete.
Access: Keep client data separate and test permissions with two client accounts.
Quality: Track errors, delivery timing, time spent, and costs. Version changes and document corrections.
My launch rule: <u>pilot with one client for one complete reporting cycle</u>. Expand only after errors are fixed and controls are retested. The goal is a report your client can use to decide what to do next.
Set Reporting Requirements
Once the core KPIs are defined, get the client’s approval on a reporting brief before setup or template work begins. Include objectives, audience, KPIs, data sources, owners, brand assets, permissions, retention, delivery rules, and approval steps.
Assign one internal reporting owner to handle definitions, data checks, approvals, and corrections.
Choose KPIs That Support Client Decisions
Start with the decision each audience needs to make. Then choose only the metrics that help them make it. Operators track activity and replies, sales leaders track quality and meetings, and executives track pipeline and revenue.
For lead-generation reporting, keep activity, lead quality, and revenue metrics separate. Document each KPI’s formula, source, counting rules, attribution window, target, and owner. Targets need client approval - they aren’t universal benchmarks.
Keep early signals separate from outcomes. Remove any metric that doesn’t point to a clear action when it misses its target. Use these definitions as the source of truth for templates and dashboards.
Choose Reports, Dashboards, or Both
Match the format to the audience and how they review results. A dashboard is only as current as its slowest source, so display both the source update time and the refresh time. Don’t promise real-time reporting until you’ve checked the full data path.[3][4]
Format
Update frequency
Audience
Detail and accessibility
Snapshot record
Best use
Scheduled PDF
Fixed daily, weekly, or monthly delivery
Executives and client reviewers
Selected summary; easy to open and archive, with limited interaction
Preserves the delivered snapshot
Scheduled business reviews and approval workflows
Live dashboard
Depends on source and connector schedules
Operators and analysts
Filters and drill-downs; requires controlled access
Retain exports to preserve past results
Daily monitoring and self-service investigation
Combined delivery
Scheduled PDF plus dashboard updates
Executives and operating teams
Summary with access to deeper detail
Preserves review records when PDFs and change history are retained
Formal reviews supported by regular optimization
Use PDFs for review and dashboards for day-to-day optimization.
Set Reporting Dates and Delivery Rules
Specify the reporting period, comparison period, data cutoff, delivery time, approved recipients, channel, approver, and escalation contact. State whether dates cover calendar months, rolling windows, or campaign periods - and whether the end date is included.
Label dates, times, and currency clearly:
November 6, 2026, 9:00 AM ET, and $1,250.00.
Allow a 24–48-hour buffer for lagging sources before publication.[4][5]
Store timestamps in UTC and schedule delivery in the client’s IANA time zone.
Example: America/New_York.
Define how weekends and U.S. holidays affect delivery, set approval deadlines, and explain what happens when approval or data arrives late. Require approval for recipient changes, keep each client’s data separate, and specify when reports, exports, and audit logs must be deleted.
sbb-itb-a781ab9
Organize Reporting Data
Create a source register for each system. Include its owner, purpose, access method, identifier fields, update schedule, time zone, attribution window, and known limitations. Assign outreach data to the campaign manager, CRM stages to the client’s sales manager, and closed revenue to finance.
Keep raw exports unchanged, store calculation logic separately, and publish only the metrics listed in the approved brief.
Define Funnel Metrics and Calculations
Use the source register to map each system event to one counted metric. For every funnel stage, document the source event, inclusion criteria, date field, denominator, exclusions, and counting unit: person, company, conversation, or meeting.
Metric
Counting rule
Sourced lead
Prospect added during the reporting period, counted once
Enriched record
Lead with required contact and firmographic fields completed or verified
Reply
Inbound response classified as a meaningful prospect reply, excluding bounces, automatic notices, and out-of-office messages
Qualified opportunity
Lead or reply that meets agreed qualification criteria, such as target role, company size, buying intent, and service fit
Booked meeting
Calendar appointment created and linked to a qualified lead
Held meeting
Booked meeting with attendance marked completed, excluding cancellations and no-shows
Multiply each rate by 100 and display N/A when the denominator is zero. Specify the cohort used for show rate, deduplicate records using a canonical identifier, and document the revenue attribution model and window.
Treat cancellations as unheld meetings. Don’t count reschedules as new bookings, and disclose adjustments made when records arrive late.
Check Data Before Publishing
Check for missing IDs, duplicates, failed connections, incomplete reporting periods, and unexpected changes. Reconcile lead stages and meeting outcomes across outreach records, the CRM, and calendars. Then recalculate a sample using raw data.
Missing data is not zero. Show each source’s last successful update, mark affected results provisional, and log the issue, owner, affected metrics, and correction status.
Once the counting rules are set, map each platform event to the exact report field it feeds.
Connect sourcing to deduplicated leads, and enrichment to completed records and enrichment completion rate. Map outreach and follow-ups to message activity and replies. Connect AI replies and inbox management to categorized responses and response time, and lead scoring to score distribution and high-priority leads. Map meeting booking to booked meetings, booking rate, held meetings, and show rate.[6][7]
Before setup, verify integrations, export options, API or webhook access, dashboard fields, and reporting capabilities in the agency account. Trace a small sample through sourcing, enrichment, outreach, reply handling, booking, and CRM updates. Confirm that each event appears once in its intended metric.
Build Branded Report Templates
Create one agency-owned master template with a locked layout, typography, charts, disclosures, and approved formulas. Allow edits only to approved fields: client name, goals, KPIs, reporting period, and commentary. Store client settings separately so master updates never overwrite them. Assign a template owner to approve changes and check quality.
Populate the master template once using the approved KPI brief, then reuse it across clients. Follow the approved definitions and source register, and keep core calculations outside the template.
Set Branding and Client Details
Standardize logos, colors, fonts, titles, headers, footers, page numbers, and contact details. Use field mappings for client names and dates.
Before export, check file names, metadata, hidden layers, image names, and URLs for unintended vendor references. Check contract terms before removing attribution, and retain required disclosures.
Apply the same branding checks to how clients access and receive reports - not just the report file.
Set Up Branded Domains and Senders
Use an agency-controlled subdomain with HTTPS, and name an owner for certificate renewals. Set up an approved sender name, agency email address, monitored reply-to address, and support messages that explain how to access reports.
Test the experience as a client, including login screens, shared links, invitations, password resets, notifications, and error pages. Brand each client-facing message path separately.
Make Charts and Commentary Clear
Label every chart with its reporting period, unit, comparison baseline, source, and a short metric definition. Place commentary beside the chart it explains, clearly separating results, causes, and next steps. Treat causes as hypotheses unless the evidence is strong, and distinguish estimated pipeline from confirmed revenue. Require human review of AI-generated commentary before publication.[1][2]
Use direct labels, line styles, or markers rather than relying on color alone. Maintain 4.5:1 contrast for text and 3:1 for essential chart graphics. Test desktop, mobile, and PDF outputs for clipped labels, unreadable legends, broken links, awkward page breaks, and commentary separated from its chart.[8][9]
Once the template is locked, automate delivery and access controls.
Automate Delivery and Secure Access
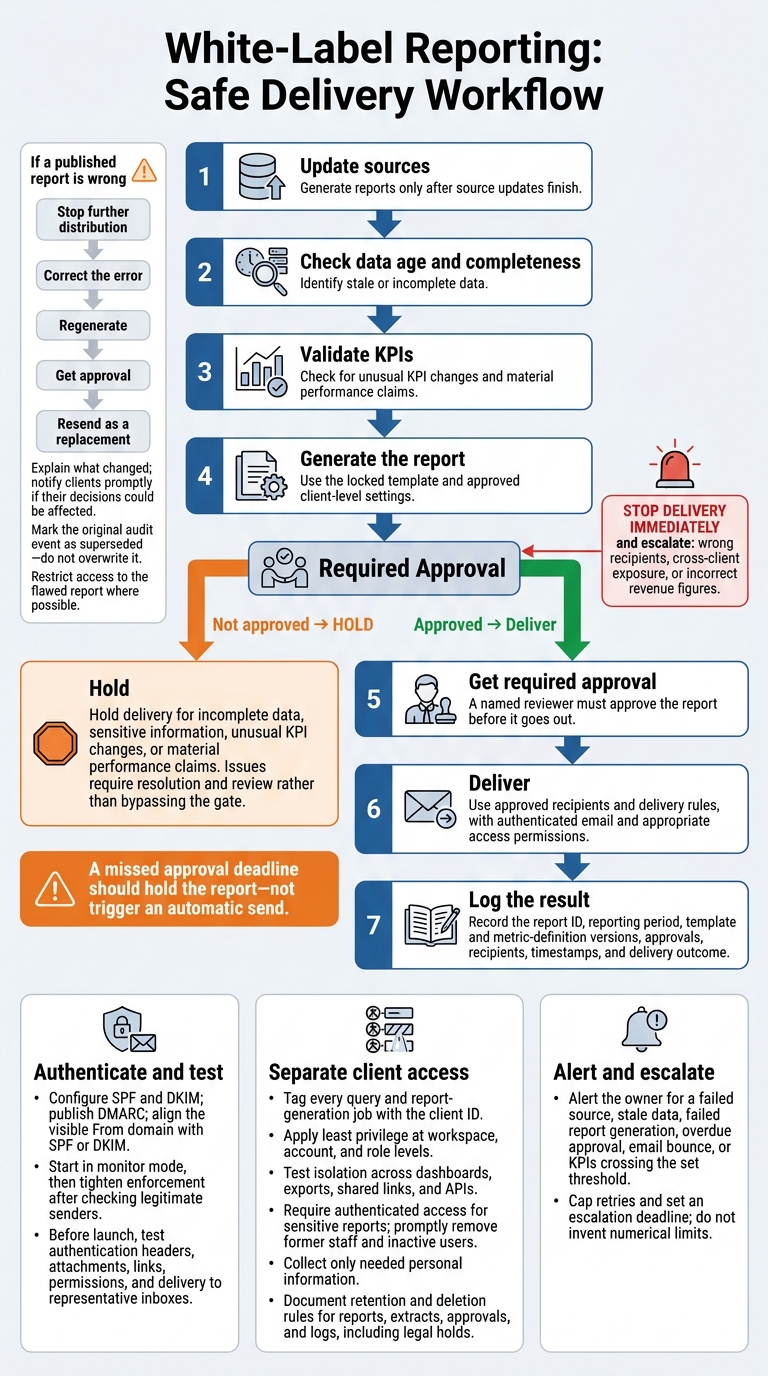
White-Label Reporting: Safe Delivery Workflow
Once the template is locked, set delivery and access controls. Follow a fixed sequence: update sources → check data age and completeness → validate KPIs → generate the report → get required approval → deliver → log the result. Generate reports only after source updates finish. Hold delivery when data is incomplete, contains sensitive information, shows unusual KPI changes, or makes material performance claims. A named reviewer must approve the report before it goes out.
Schedule Delivery and Authenticate Email
White-label delivery should match your brand and arrive on schedule - but only after email authentication passes. Save approved delivery rules, recipients, and the approval owner in client-level settings.
Configure SPF and DKIM, publish DMARC, and align the visible From domain with SPF or DKIM. Start in monitor mode, then tighten enforcement after checking legitimate senders. Before launch, test authentication headers, attachments, links, permissions, and delivery to representative inboxes. A missed approval deadline should hold the report - not trigger an automatic send.
Separate Client Data and Limit Access
Keep each client’s data separate to protect the white-label experience. Tag every query and report-generation job with the client ID. Apply least privilege at the workspace, account, and role levels.
Use client test accounts to check isolation across dashboards, exports, shared links, and APIs. Require authenticated access for sensitive reports, and promptly remove former staff and inactive users. Collect only the personal information needed. Document separate retention and deletion rules for reports, extracts, approvals, and logs, including legal holds.
Handle Failures and Report Corrections
Alert the owner when a source fails, data becomes stale, report generation fails, approval is overdue, email bounces, or KPIs cross the set threshold. Cap retries and set an escalation deadline. Wrong recipients, cross-client exposure, or incorrect revenue figures must stop delivery immediately and trigger escalation.
Log report IDs, reporting periods, template and metric-definition versions, approvals, recipients, timestamps, and delivery outcomes.
If a report is wrong, stop further distribution. Correct the error, regenerate the report, and get approval before resending. Label the resend as a replacement and explain what changed. Notify clients promptly if the error could affect their decisions. Mark the original audit event as superseded rather than overwriting it, and restrict access to the flawed report where possible.
Maintain Quality as Reporting Scales
Once delivery is automated, run recurring QA to catch errors before clients do. As reporting volume grows, small mistakes in definitions or delivery can spread across client reports.
Assign an owner and a backup to each reporting function: metrics, data connections, templates, client approvals, and delivery. Each correction also needs one owner and one reviewer. Require same-day acknowledgment and a fix within two business days for material errors.
Use a Regular Quality Checklist
Have the preparer complete the QA checklist each reporting cycle and the reviewer approve exceptions. This keeps checks in place as you add clients, sources, and templates.
Review templates quarterly and whenever a source, KPI, attribution rule, or client objective changes. Remove outdated KPIs, fix broken charts, and check that filters point to the right fields.
Failure mode
Check
Corrective action
Missing data
Compare data freshness, nulls, and record counts with the baseline.
Fix recurring gaps; escalate unresolved critical issues within four business hours.
Attribution errors
Reconcile funnel results and revenue with agreed sources and attribution windows.
Fix mappings or attribution logic and rerun affected periods; escalate material discrepancies.
Inconsistent definitions
Check calculations against the metric dictionary.
Replace local formulas with governed logic; escalate unresolved conflicts.
Branding errors
Check the client name, logo, colors, sender, domain, and reporting period.
Fix and regenerate; notify the account owner if the report was already sent.
Access violations
Confirm recipients can access only their client’s reports.
Revoke access granted without permission and escalate immediately.
Failed delivery
Review scheduler logs, bounces, suppressions, and dashboard uptime.
Escalate failures that exceed the documented retry window.
Use the checklist to prevent defects and the scorecard to spot patterns over time.
Track Reliability, Time, and Cost
Review a monthly scorecard by client, template, source, and channel. Check whether features">automation cuts work without reducing accuracy.
On-time delivery: reports delivered by the agreed deadline ÷ reports scheduled × 100.
Successful data update rate: completed, validated refreshes ÷ scheduled refreshes × 100. Keep scheduled refreshes in the denominator so skipped jobs remain visible.
Correction rate: reports requiring a material correction after publication ÷ reports published × 100.
Dashboard availability: uptime minutes ÷ eligible minutes × 100. Document maintenance exclusions, downtime, and the measurement period.
Email bounce rate: bounced messages ÷ attempted messages × 100. Track hard and soft bounces separately.
Preparation time per client or cycle: total analyst and operations minutes ÷ clients or reporting cycles completed. Specify which denominator you use.
Cost per report: allocated labor, software, data, and delivery costs ÷ reports produced. Include support and correction labor.
Read these figures alongside client feedback. Recurring connection failures point to source-level problems. If corrections increase after a template release, pause the rollout. Faster production isn’t an improvement if accuracy falls.
When a fix becomes permanent, version it so future reports follow the same rule.
Version Templates and Metric Definitions
Keep shared calculations in a governed metric catalog rather than copying them into each template.[10][11] Version templates, formulas, source mappings, attribution rules, and client overrides to protect historical comparisons as reporting changes.
Require documented approval for material changes. Record the reason, affected clients, test results, effective date, and rollback plan. Store approved client exceptions separately, each with an owner and review date. Pilot changes against manually validated results, then monitor the first two or three cycles.
In the first report after a change, explain the old and new methodology and state whether historical figures were restated. Avoid unqualified period-over-period comparisons when definitions differ. Keep past reports and calculation snapshots under the agency’s retention policy.[12]
Once automation and QA are in place, use a pass/fail launch checklist as your final go-live gate:
Reporting brief approved and metric definitions documented
Source totals reconciled and cross-client access blocked
Branding approved and delivery tested
Alerts active, with owners and backups assigned
For every publication, record the report version, metric-definition version, data refresh timestamp, validation result, approver, and delivery status.
Before launch, test access with two separate client accounts across dashboards, exports, emails, and APIs. Confirm that neither account can access another client’s data.[13][14][15] Send a test report to designated client contacts. Check permissions, reporting dates, time zone, and sender authentication.
Pilot with one client for at least one complete reporting cycle. This is your first live test of report accuracy, access control, and delivery reliability. Test the failure-handling process, then record defects, time spent, and client feedback. Ask the client to approve the report’s usefulness and interpretation - not just its appearance.
Expand only after critical issues are fixed and retested. Pause if KPI variance is unexplained, cross-client access appears, alerts fail, or delivery is unreliable. Retest the affected controls.
FAQs
How do I price white-label reporting for clients?
Aim for a 60%–70% gross margin. Charging 3–5 times your platform cost is a common starting point. Set flat monthly tiers or service-level packages instead of per-seat pricing, and factor in platform fees, labor, and support overhead.
Present your branded dashboard as a premium feature that shows ROI and helps justify higher retainers. Spell out deliverables, usage limits, and overage charges in your contracts to protect your margins.
How can I customize reports without increasing manual work?
Use a white-label platform to automatically pull updated campaign metrics - leads generated, meetings booked, and pipeline value - into branded dashboards your agency owns. Schedule data updates so clients see current numbers without manual exports.
Choose industry-specific templates for different client tiers, and use AI to draft performance summaries. This lets you deliver tailored insights and big-picture strategy reviews while keeping your reporting workflow consistent and automated.
How should I handle conflicting data across sources?
Before you start reporting, set a source of truth for each KPI. Use your outreach platform for activity metrics and your CRM for pipeline and meeting data. Put these rules in writing - ideally in your client contract - so your team and client work from the same baseline.
Agree on what counts as a qualified lead or a positive reply. Then, before sending each report, run a brief quality assurance check against the designated source records to keep your reporting accurate and maintain client trust.