Lead Scoring: Combining Demographic and Firmographic Data
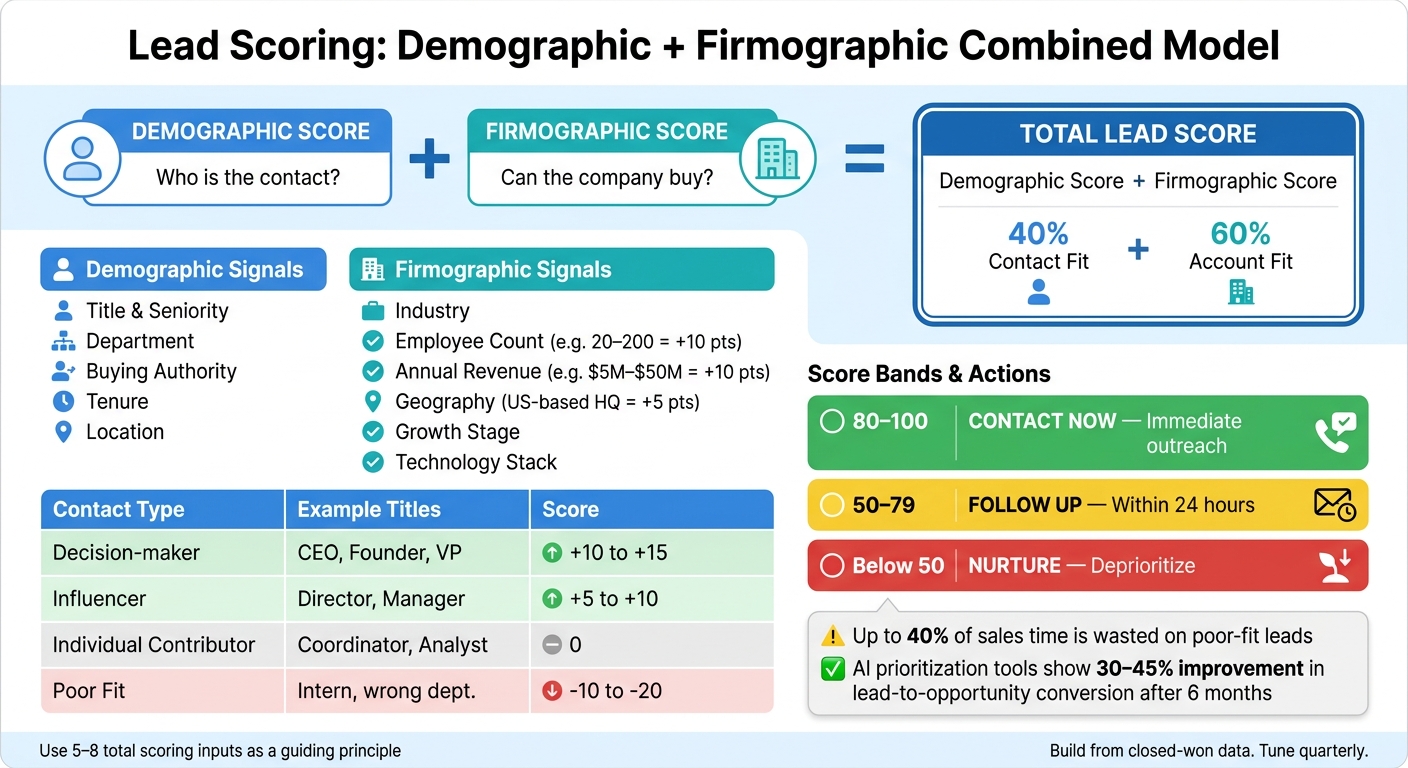
If you score only the person or only the company, you will rank leads the wrong way. I’d use a two-part score: who the contact is and whether the account can buy.
Here’s the short version:
Demographic data tells me if the contact can influence the deal
Firmographic data tells me if the company fits my pricing, service model, and market
A simple model often works: 40% contact fit and 60% account fit
I’d keep it to 5–8 scoring inputs
Common score bands:
80–100: contact now
50–79: follow up within 24 hours
Below 50: nurture or deprioritize
The article’s main point is simple: I get a better pipeline when I score both sides before I look at engagement. That helps cut wasted sales time, which can be as high as 40% on poor-fit leads, and it gives me a cleaner way to rank accounts, review conversion by score band, and tune the model with closed-won data.
A few signals matter most:
On the contact side: title, seniority, department, and buying influence
On the account side: industry, employee count, annual revenue, location, growth stage, and tech stack
In review: meeting rate, close rate, deal size, and 6- and 12-month retention
Score Layer
What I’m checking
Typical examples
Demographic
Can this person help move the deal?
CEO, VP, Director, Manager, wrong department
Firmographic
Can this company support the deal?
SaaS, 50–200 employees, $5 million–$50 million revenue, U.S.-based
In short, this article explains how I’d build a lead score that reflects buying fit, not just job title or company size on its own.
Lead Scoring Model: Demographic vs. Firmographic Data Breakdown
Demographic Data: Scoring the Individual Fit
Core Demographic Signals to Track
Score the contact by asking one simple question: can this person influence the purchase?
Title and seniority usually carry the most weight. But title on its own can mislead you. Add department, authority, tenure, and location only when those details change buying access or affect whether your team can serve the account.
According to Gartner, the median B2B buying group involves 6 to 10 decision-makers, each bringing 4 to 5 pieces of independently gathered information[2]. The goal is not one perfect contact; it is one contact who belongs in the buying group.
How to Assign Positive and Negative Scores
A simple point-based model is usually enough. Give the highest scores to contacts with budget authority or clear ownership of the function tied to your offer. Give mid-range scores to people who help shape the shortlist. Give low or negative scores to contacts who are unlikely to move a deal forward.
Contact Type
Example Titles
Scoring Action
Decision-maker
CEO, Founder, Owner, VP, Head of Department
High positive (+10 to +15)
Influencer
Director, Manager, Senior Specialist
Moderate positive (+5 to +10)
Individual contributor
Coordinator, Analyst, Associate
Neutral (0)
Poor fit
Student, Intern, Contractor, wrong department
Negative (-10 to -20)
Be careful with negative scores. Use them only when a trait clearly lowers fit for your offer. Then check those weights against closed-won data. If those negatives are pushing down contacts who ended up converting, pull them back.
Every score should tie back to your ICP and line up with closed-won deals. Start by scoring the contact side. After that, score the account side.
Once the contact fit is scored, measure whether the account itself can support the deal.
sbb-itb-a781ab9
Lead Scoring and Qualification
Firmographic Data: Scoring the Account Fit
Once you've scored the contact, score the account itself.
Firmographic scoring tells you if a company lines up with your service model, pricing, and delivery limits. This is the account-fit side of your combined score.
The Most Useful Firmographic Attributes
The firmographic signals that matter most are industry, company size, annual revenue, geography, growth stage, and technology stack.
Firmographic Attribute
What It Tells You
Scoring Direction
Industry
Whether the account fits the verticals where you have proven results
+15 for target industries; +5 for neutral industries; −10 for industries outside your expertise or requiring heavy compliance
Company size (employees)
Operational complexity and likely scope of work
+10 for 20–200 employees; +5 for 10–19 or 201–500; 0 or −10 for <10 or >1,000
Annual revenue
A rough proxy for buying power and budget range
+10 for $5M–$50M; +5 for $1M–$4.9M; 0 for <$1M; −5 for accounts under $500K if they typically can't support your pricing
Geography
Time zone alignment, regulatory fit, and service coverage
+5 for US-based HQ; 0 for other English-speaking markets; −5 for regions that create delivery friction
Growth stage
Investment mindset and urgency
+10 for growth-stage companies; +5 for mature companies investing in optimization; 0 for pre-product-market-fit startups; −5 for declining or distressed companies
Technology stack
Integration compatibility and onboarding complexity
+10 for preferred tools; +5 for mainstream stacks; −5 for custom or outdated systems
Here's the key part: only score the attributes that line up with your best customers.
Don't build this from guesswork. Build it from your closed-won data. If your top accounts tend to be mid-market SaaS companies in the U.S. using a certain stack, your scoring should reflect that. If enterprise companies slow down delivery or small businesses struggle with your pricing, score that honestly.
Why Firmographics Help Gauge Budget and Market Fit
Firmographic data gives you structural signals that contact-level data can't.
Revenue and headcount, taken together, give you a decent read on budget range and sales complexity. A 50-person company doing $10 million a year usually looks very different from a 5-person company doing $400,000. Same market, very different buying motion.
Growth stage adds another layer. A company that's growing fast is often under pressure to hit hard KPIs, so it may move faster. A startup that's still early may still be a fit, just not a fit right now. That distinction matters. It helps you sort accounts that are ready today from accounts that may make sense later.
Use firmographic scoring as your account-fit baseline before combining it with demographic fit. Next, combine this account score with demographic fit.
Building a Combined Lead Scoring Model
Use the contact score and account score together to rank leads by fit. If you rely on just one signal, you can miss the full picture.
A Simple Weighted Scoring Framework
Bring contact and account scores into one number your team can scan fast. Score demographic fit and firmographic fit on their own, then combine them. A common split is 40% demographic and 60% firmographic.
Keep the point system small and consistent so strong matches stand out and poor matches are easy to spot. In most cases, 5 to 8 total attributes is enough to keep the model easy to run.
Total Score = Demographic Score + Firmographic Score
The right split depends on how your agency sells. There’s no magic formula. The goal is to match the weighting to the way deals happen in your pipeline.
How to Choose the Right Weighting Strategy
Approach
Best Use Case
Trade-Off
Firmographic-heavy
Larger deals and longer cycles
Filters poor-fit companies fast; may miss the right champion
Identifies the right buyer; can create false positives if the company can't buy
Most agencies should start with the balanced model. It’s the safest place to begin, especially if your sales motion sits in the middle.
If your deals are larger and usually involve several stakeholders, lean more on firmographic signals. If you sell a niche service to one very specific role, no matter the company size, lean more on persona.
Once you’ve set the weighting, the next step is simple: turn the score into a clear action threshold.
Score Ranges for Lead Prioritization
A score matters only if it leads to action. Set your ranges before launch, and link each range to a clear next step.
For most agencies, a simple three-tier setup works well:
Set these thresholds using your own closed-won data. High-scoring leads should turn into more booked meetings and more wins than lower-scoring leads. If that’s not happening, the model needs tuning before you plug it into your agency workflow.
How Agencies Can Put the Scoring System to Work
Once contact and account scores are in place, the next step is simple: turn them into a process your team can use over and over again.
Start With the ICP and Map Attributes to It
Begin with your best customers. Look at your top closed-won accounts from the past 12–24 months, especially the ones that brought strong ROI, stuck around, and kept margins healthy. Then track the patterns: industry, company revenue, and the titles of the people who signed.
From there, build 1–3 ICP archetypes based on what you find. For example: "VC-backed B2B SaaS company, 50–200 employees, Head of Marketing based in a U.S. major metro." Then assign points to each trait. A target industry might get a positive score. The wrong company size might get a negative one. A title that lacks buying power should also lower the score.
Keep those rules in one shared playbook so everyone follows the same system, not their own gut instinct.
Once the rules are mapped out, check them against what’s happening in your pipeline now.
Review Scores Against Real Conversion Data
This is where scoring stops being theory and starts proving itself. Use conversion data to see whether your rules line up with how people actually buy. Set a monthly or quarterly review and ask one direct question: are high-scoring leads converting better?
Break your pipeline into score bands like these:
80–100
60–79
Below 60
Then compare meeting rate, close rate, deal size, and 6- and 12-month retention across each group. If leads scoring 60–75 are closing more business than leads scoring 80+, your weighting needs work. That usually means one of your “good” signals isn’t as strong as you thought, or one weak signal is getting too much credit.
Adjust the weights based on what lines up with high lifetime value. If an attribute keeps showing up in churned accounts or low-value deals, cut its score or switch it to a negative. The point isn’t to prove demographic data or firmographic data on its own. The point is to make sure the full model predicts results.
Companies using AI prioritization tools see 30–45% improvement in lead-to-opportunity conversion rates after 6 months. [3] So don’t treat the model like a fixed rulebook. Treat it like something you tune as new data comes in.
Using Real-Time Enrichment and Scoring in Agency Workflows
Once your rules are working, automate them the moment a lead enters your system.
Manual research takes time, and it tends to vary from one person to the next. Real-time enrichment fixes that by adding industry, employee count, revenue, title, seniority, and time zone as soon as the lead comes in. Your scoring rules are then applied right away, so every lead gets judged by the same standard no matter who is handling the queue.
SalesLabel supports this workflow. It handles automated enrichment and real-time lead scoring so every lead is scored the same way at scale under your agency's brand. [1]
Conclusion: Better Fit Data Builds a Better Pipeline
Once you separate contact fit from account fit, the upside becomes pretty obvious. When you combine demographic and firmographic data, you close the gap between who looks like a fit and whether the account is worth your time.
That same approach makes execution easier for the team, too. Agencies that score both the person and the account waste less time on poor-fit leads and spend more time talking with people who can actually move a deal forward. That leads to higher win rates and more dependable forecasting.
When scoring rules are clearly defined, documented, and used the same way across the team, everyone works from one standard. SDRs ramp faster, senior reps spend more time on high-value conversations, and the pipeline starts to reflect your ICP instead of individual judgment.
As more closed-won and closed-lost data flows back into the model, it gets easier to spot which signals predict revenue and which ones don't. The result is a lead score built around real buying potential, not just activity or job title.
FAQs
How do I pick the right weights?
Start with your Ideal Customer Profile (ICP) and engagement levels. Mix fit scores and engagement scores with time-decay factors so rankings stay current as prospect interest shifts.
Then check those weights against actual conversion metrics to see which signals line up with closed business. SalesLabel can make this easier with AI-powered, real-time lead scoring.
What if I have incomplete lead data?
Use automated lead enrichment tools to fill in missing demographic and firmographic details. SalesLabel helps by automating lead sourcing and enrichment, so agencies can keep profiles accurate and make lead scoring more useful.
And if some data points are still missing, you’re not stuck. With predictive AI and real-time data analytics, teams can still score prospects with a solid level of accuracy, while keeping outreach personal and driven by data.
How often should I update the model?
There’s no fixed update schedule in the source material. The main idea is simpler than that: check predictive AI models on a regular basis against current conversion metrics.
That matters because buyer behavior shifts. Fast. A model that worked well a month ago can start to drift if your pipeline, traffic patterns, or lead sources change.
Using real-time data from your CRM, web activity, and intent signals helps keep scores accurate and useful. It lets the AI adjust to changes in how people research and buy, without relying on a rigid manual refresh schedule.