How Predictive Analytics Improves CRM Lead Scoring
Use predictive analytics to score CRM leads: clean data, one prediction goal, and action-tied bands that improve response and conversions.
SalesLabel Team
Growth Expert • 30.09.2026
Share:
Cauți o soluție gata de utilizare?
SalesLabel automatizează prospectarea de la un capăt la altul — AI găseşte prospecți, trimite mesaje personalizate şi rezervă întâlniri sub brandul tău.
How Predictive Analytics Improves CRM Lead Scoring
Predictive lead scoring helps you spend sales time on leads that are more likely to convert. Instead of using fixed rules, I’d use past CRM data to score leads based on fit, intent, and past outcomes - then connect those scores to routing, follow-up, and nurture steps.
Here’s the short version:
I’d pick one clear goal to predict, such as a booked meeting, SQL, or closed-won deal.
I’d train the score on clean historical CRM data, not messy or mixed records.
I’d remove future-only fields so the model doesn’t cheat.
I’d push scores into the CRM as simple fields like Score, Band, and Last Scored.
I’d tie each score band to a clear action, like reply within 5 minutes or place the lead into nurture.
I’d track results by segment, score band, and conversion rate so the score stays useful over time.
One stat from the article stands out: replying within 5 minutes can lead to conversion rates that are 8x higher than replying later. That’s why lead scoring is not just about ranking leads. It’s about helping sales teams act on the right lead at the right time.
If I had to sum up the whole article in one line, it would be this: a lead score only matters when it is built on clean CRM data, tied to one business goal, and connected to clear sales actions.
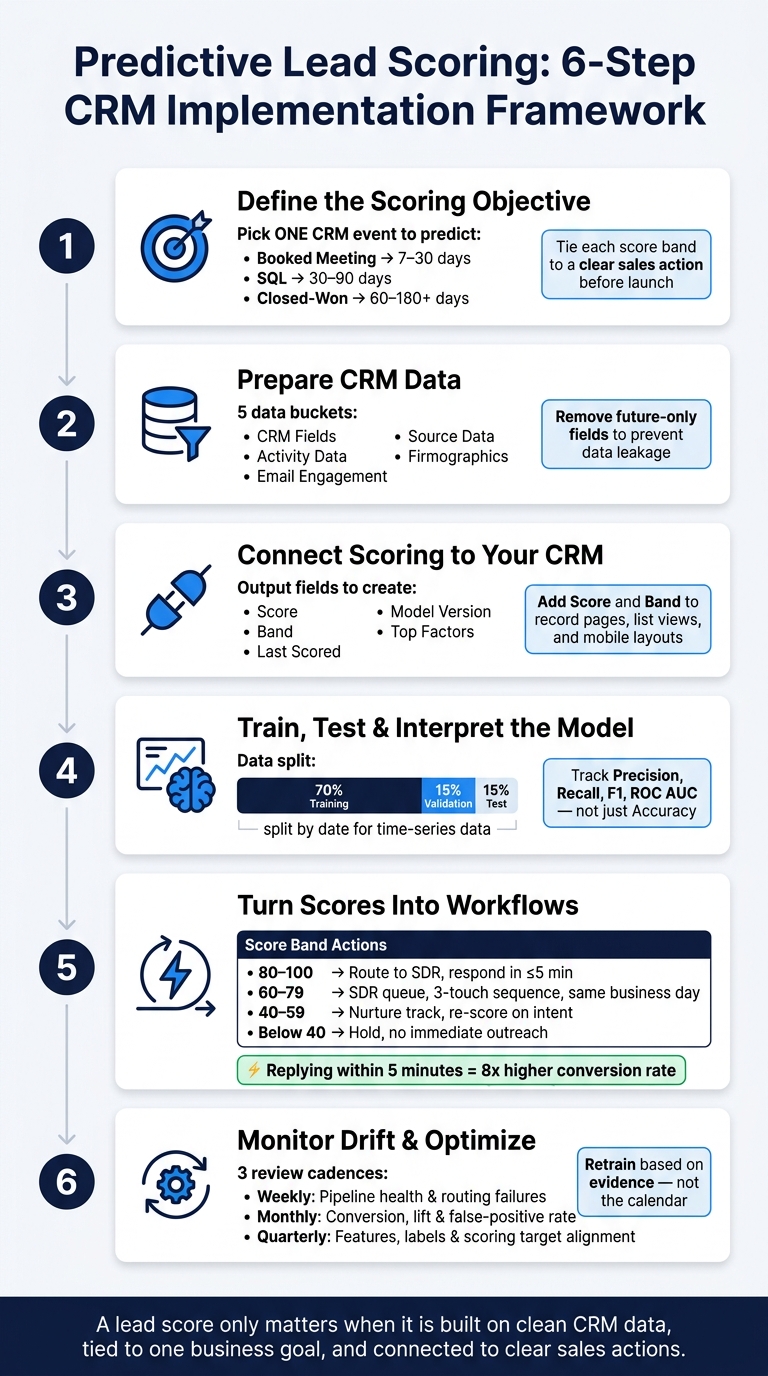
Predictive Lead Scoring: 6-Step CRM Implementation Framework
Step 1: Define the Scoring Objective
Start by picking one CRM event the model will predict.
That sounds simple, but it matters a lot. Before anyone touches the data or builds a model, the team needs to agree on the exact outcome. A score only works when it points to one clear result. If the target is fuzzy, the model picks up mixed signals and ends up learning patterns that don't line up.
Choose the Outcome to Predict
A good place to start is with one clearly defined conversion event, like a booked meeting, a sales-qualified opportunity (SQL), or a closed-won deal. Each one supports a different sales goal.
Outcome
Typical prediction window
Best use
Main limitation
Booked meeting
7–30 days
Prioritizing immediate outreach and appointment-setting
A meeting does not necessarily signal buying intent or revenue potential
Sales-qualified opportunity
30–90 days
Triggering the marketing-to-sales handoff
Qualification criteria can vary by rep or territory
Closed-won deal
60–180+ days
Revenue prioritization and pipeline planning
Requires mature, consistently recorded opportunity data
The outcome also needs to be logged the same way in the CRM. If reps use different definitions, the model learns conflicting patterns, and the score gets shaky fast. So before you commit to a label, audit how the team actually records these events.
A useful objective statement looks like this:
For [eligible leads] scored at [time], predict whether [one CRM event] will occur within [30, 60, or 90 days] so the team can [action].
For example:
For new U.S. SaaS leads scored 24 hours after submission, predict an SQL within 60 days so reps can prioritize high-probability accounts.
Set Scope and Score Usage
Once the outcome is set, tighten the scope.
If one model is trained across very different sales motions - say, enterprise renewals mixed with small-business new business - the scores can become hard to use. The patterns behind those deals are often too different. It’s better to start with one product line, one pipeline, or one customer segment where the sales process is consistent and the outcome means the same thing across the team.
Then decide what each score band should do. If there’s no action tied to the number, the score is just noise.
Before launch, map each score band to a clear workflow. For example:
High-probability leads go to an assigned rep for personalized outreach within one business day
Mid-range leads enter a monitored follow-up queue
Low-probability leads stay in automated nurture while the team gathers more signals
Set those thresholds using capacity and conversion data, not gut feel.
sbb-itb-a781ab9
Step 2: Prepare CRM Data for Predictive Analytics
Once the scoring goal is set, the next job is making your CRM data usable. That sounds simple. It usually isn't.
Most CRM datasets have holes, conflicting values, and fields that look helpful but can throw the model off. Clean that up before training. The goal here is to separate signals the model can trust from fields that only seem useful.
Identify the Right Data Sources
Group your inputs into five buckets:
CRM fields: contact and account records, deal history, lifecycle stages, opportunity stages, lead status, owner assignments, creation dates, activity dates, close dates, and closed-lost reasons
Activity data: calls, meetings, tasks, replies, and response times
Email engagement: sends, clicks, replies, and unsubscribes
When policy allows, behavior signals can add useful intent data. That includes pricing-page visits, content downloads, demo requests, and return visits. If you're using enrichment or third-party data, keep the provider name, collection date, and match-confidence value tied to each record. A field from an outside vendor shouldn't be treated the same as a confirmed CRM field until it's been checked.[2][3]
Use one lead or account ID across the dataset, and timestamp every event so records join in the right order.
Clean, Label, and Validate Historical Records
Real CRM data almost always gets smaller after cleaning and feature selection.[5]
The main cleanup work comes down to deduplication, standardization, and label validation. Deduplicate using normalized email, domain, and CRM ID. When you merge duplicates, keep the earliest create date and the full activity history. For categorical fields, use controlled values instead of free text. Industry, state abbreviations, job-title categories, lifecycle-stage labels, and lead sources should all follow the same format.
Dates need the same discipline. Store timestamps internally in ISO 8601 format (2026-09-30T14:30:00Z) and show them to U.S. users as 09/30/2026. Convert all event timestamps to UTC before you calculate time intervals.[2]
Then label your historical records using the outcome window you picked earlier. Mark a lead as positive if it creates a qualified opportunity inside the prediction window. Mark it negative only after that window closes with no conversion. Leave out in-progress leads.[1] It's also smart to manually check a sample of won and lost records against opportunity and revenue data. That helps catch CRM admin mistakes before they turn into training noise.
Once the training set is clean, strip out anything that gives the model future knowledge.
Avoid Data Leakage
Data leakage is one of the easiest ways to get a model that looks great in testing and falls apart in production. It happens when training data includes fields that would not have existed at the time the prediction was meant to happen.
Common leakage sources include closed-won flags, close dates, late-stage pipeline fields, post-call notes, and hot-lead status assigned after the outcome was already known.[4] If a field was not available at the prediction timestamp, leave it out.[4]
A good rule is to apply a feature cutoff timestamp to every training example and include only events recorded before that cutoff. Another useful check is to train a baseline model using only data available at lead creation, then compare it with a model that includes later fields. If performance jumps by an amount that seems too big to be believable, leakage may have slipped in.[4]
After the data is time-safe, it's ready to map into CRM fields and scoring events.
Step 3: Connect Predictive Scoring to Your CRM
With clean, time-safe data ready, the next move is to connect model output to your CRM so the scores lead to action.
Map CRM Fields and Events
Once the model is trained, turn its output into CRM fields and triggers. For each model input and output, define the CRM object - lead, contact, account, or opportunity - the exact field name, data type, allowed values, and which system controls updates. That cuts down on surprise overwrites and makes troubleshooting much easier later.
On the input side, map firmographic details like industry, employee count, geography, and job title to account and contact fields. On the output side, create dedicated fields for Score, Band, Last Scored, Model Version, and Top Factors. Top Factors matters for one simple reason: reps need to know why a score moved, not just that it changed.
Be precise with event fields before you map them. For high-value events like demo requests, pricing-page visits, inbound replies, and meeting bookings, set up near-real-time sync. For slower-moving fit data, such as firmographic enrichment or campaign aggregates, a daily refresh is usually enough.
After that mapping is done, put the scores where reps already spend their time.
Make Scores Visible and Actionable
A score doesn’t do much if reps can’t see it and use it fast. Add Score and Band to the record pages, list views, and mobile layouts your reps already rely on. Then build views that turn scoring into a daily work queue.
For example:
High score, not contacted
Score increased in the last 24 hours
High fit but low engagement
Those views give reps something concrete to act on right away.
Each score band should connect to a clear next step. High scores go to priority follow-up. Midrange scores move into nurture. Low scores stay suppressed until new intent shows up. Then tie those bands to routing rules and features">automation so every threshold kicks off a workflow instead of sitting there as just another number.
It also helps to add guardrails from day one. Set stop conditions that block automation when a contact has opted out, is already tied to an open opportunity, or belongs to another rep. The score helps with prioritization. Business rules, consent, and rep judgment decide what happens next.
For agencies handling outreach across many clients, SalesLabel can turn score changes into immediate follow-up while the CRM stays the source of truth. In plain English, that means teams can use score changes in day-to-day outreach without messing up CRM ownership.
Once scores are feeding CRM actions, the next step is checking whether the model is predicting well.
Step 4: Train, Test, and Interpret the Model
Once your CRM data is mapped and time-safe, the next job is simple: check whether the model can rank unseen leads the right way.
Split Data for Training and Testing
Before you use any model on live leads, test it on records it hasn't seen before. A solid starting point is a 70% training, 15% validation, and 15% test split. You can change those shares based on total lead volume and conversion count, but the setup stays the same: train on one set, tune on another, and keep a final test set aside for an unbiased read on performance.
For time-sensitive CRM data, split by date. Use the oldest records for training, the middle period for validation, and the newest completed records for testing.
If leads don't depend on each other, use stratified sampling so each split keeps the overall conversion rate about the same. Also, keep related records from the same account, opportunity, or campaign in the same split. That group-based split helps stop account-level signals from leaking into the test set.
A good split gives you metrics you can trust.
Review the Right Performance Metrics
Accuracy can point you in the wrong direction when conversions are rare. That's why it's better to track precision, recall, F1, and AUC. In low-conversion settings, a precision-recall curve and its area under the curve can be especially useful.
Metric
What it measures
When it matters most
Precision
Share of predicted converters that actually convert
Limited rep capacity
Recall
Share of actual converters the model caught
Missing buyers is costly
F1 Score
Balance between precision and recall
Balance of false positives and negatives
ROC AUC
Overall ranking quality across thresholds
Compare model versions
Precision-Recall AUC
Positive-class performance when conversions are rare
Rare conversion cases
The cutoff between "high priority" and "medium priority" isn't something the model should decide on its own. It's a business choice. A higher cutoff will usually increase precision but lower recall. A lower cutoff will catch more possible converters, but it also brings in more false positives.
Here's the practical way to think about it: if your SDR team can only work 500 leads per month, set the cutoff at the point that fills that queue with the best candidates. Don't default to 0.50 just because it's there.
After you review model performance, turn those numbers into something the sales team can use.
Interpret Scores in Business Terms
Even a model that performs well on paper can fall flat if reps don't know how to act on the scores. So don't stop at raw outputs. Translate them into baseline lift, expected conversion rate, and rep priority.
There's another check that matters here: calibration. Say leads scored between 0.70 and 0.79 are converting at 4%, while leads scored 0.30–0.39 are converting at 6%. That's a calibration problem, even if the model still ranks leads fairly well. If score bands don't line up with actual conversion rates, reps can read priority the wrong way.
When that happens, it's often better to show a score band or percentile instead of a probability. That keeps reps from putting too much weight on a number that looks more exact than it is.
Each band should signal two things:
priority level
expected conversion rate
Those calibrated bands can then guide routing and follow-up.
Step 5: Turn Scores Into Sales and Outreach Workflows
Once the model ranks leads the right way, the CRM has to do something with that rank. A predictive score only matters if it changes the next move: who gets the lead, how fast someone replies, and which outreach sequence starts.
Assign Actions by Score Band
Before you go live, each score band needs clear rules: owner, response target, sequence, and exit rule. If those rules aren't set, reps will read the same score in different ways. And when that happens, the model loses its edge in day-to-day execution.
Score band
CRM action
Response-time target
80–100
Route to assigned SDR or rep, create call task, send rep alert
5 minutes or less
60–79
Assign to SDR queue, start 3-touch sequence
Same business day
40–59
Enroll in nurture track by industry or use case
Re-score on next high-intent event
Below 40
Hold for marketing or review
No immediate outreach
High-score leads need fast contact. Research on response time shows that speed can sharply improve qualification rates.[6][7] If a new intent signal comes in, the lead should be re-scored right away and moved into a faster workflow if needed.
Medium-score leads shouldn't just sit there. When intent changes, they should move back into the workflow. If new signals push them into the high band, promote them at once.
Combine Score With Human Qualification
Automation should set priority. People should confirm the situation.
A quick qualification check can confirm:
fit
decision-maker status
territory
open opportunities
contact permission
That check shouldn't slow the first reply. For high-priority inbound leads, a rep can reach out fast and confirm fit during the conversation.
It's also smart to keep fit and intent separate. A lead can show strong intent and still be a poor fit, and that's an easy way to burn sales time. When you score them on their own, routing becomes easier to explain, and overrides become less messy.
Spell out which actions run on their own, which need approval, and which stop on reply, opt-out, or disqualification.
For agencies using SalesLabel, the platform can surface high-priority leads, manage approved follow-up, and keep CRM status aligned under the agency brand.
Step 6: Monitor Model Drift and Improve Accuracy Over Time
Once the score is live, treat it like a system that needs regular upkeep, not a one-and-done project.
Predictive scores drift as campaigns, lead sources, sales behavior, and market conditions shift. When scores stop lining up with actual buying intent, reps spend time on the wrong leads. If you don't monitor scores on a regular basis, routing decisions can slowly chip away at pipeline quality.
Track Performance by Segment and Score Band
Top-line metrics can miss the problem. A model may look solid overall but still struggle in one industry, one territory, or one lead source. Review results by segment - industry, company size, campaign, and acquisition channel - and compare each score band's conversion rate, opportunity quality, and revenue impact with the launch baseline for your chosen outcome.
Track monthly conversion rate by score band versus the launch baseline, false-positive rate, lift, and calibration. Also keep an eye on response time by score band. A slowdown in contact speed can look like a model issue when it's actually a workflow issue.
A sudden jump in high-score leads should put you on alert. It can point to a data pipeline issue, a broken enrichment step, or model calibration trouble - not a real jump in lead quality.[8][9]
Use these trends to tell model drift apart from workflow problems.
Diagnose Common Scoring Problems
Start with the data. Most failures come from field mapping changes, form updates, or weaker enrichment data. Check that your inputs still match what the model was trained on.
Stale signals are a common cause. If web-intent or email data stops refreshing, the model starts scoring with partial inputs. Add freshness checks so you can spot when a signal hasn't updated inside its expected window.
For excessive false positives, review the highest-scoring leads that didn't convert and look for patterns, such as:
Automated email opens
Low-quality form fills
Firmographic rules that ignore budget and timing
For weak segment performance, compare sales response times in that segment before blaming the model itself.[8][10]
Monthly: Review conversion, lift, false-positive rate, opportunity quality, and revenue by segment and score band.
Quarterly: Reassess features, labels, campaign mix, and whether the scoring target still fits the sales goal.
Retraining should follow evidence - not the calendar. Watch for sustained lift decline, meaningful calibration deterioration, or a major change in campaign mix or CRM schema.[8][11]
When a candidate model is ready, test it against the current production model on a recent holdout period before making it the default. Set clear ownership for model performance, CRM data quality, and workflow execution. Document every model version, threshold change, and deployment date so you can roll back fast if something goes sideways.
Final Deployment Checklist
After testing and workflow setup, use this checklist to make sure the model is ready for production. Run it before launch to confirm the score can drive the right CRM actions.
Check every item before rollout. If even one is missing, score performance in the CRM can slip.
Deployment Area
Verification
Objective
One prediction target and one time window
Data quality
Duplicates, missing fields, invalid contacts, and stale activity removed
Leakage control
Only scoring-time fields used
Validation
Time-based holdout tested with AUC, precision, recall, lift, and band conversion
CRM integration
Score fields, timestamps, and bands mapped and sandbox-tested before production
Workflow activation
Each score band triggers a routing rule, response-time target, nurture enrollment, or suppression action
Sales and marketing teams know what the score means and what action each band requires
Monitoring
Dashboards track conversion, opportunity creation, response time, score distribution, and segment performance
Ownership
Named owners for data quality, model performance, CRM workflows, and change approval
Review cycle
Monthly performance review and evidence-based retraining process scheduled
Start with one segment first. Then compare results against the current scoring method and expand only if the pilot shows measurable lift.
Also, write down rollback rules, model versions, threshold changes, and band-level actions before launch. That way, the team can revert fast and stay aligned. Keep the action policy in plain language and include:
The score range
The expected action for each band
The response-time target
The escalation path
Any override conditions
A score on its own doesn't do much. The value comes from what the team does next.
FAQs
How much CRM data do I need to start predictive lead scoring?
You don’t need a huge bank of past CRM data to get started with predictive lead scoring.
Systems like SalesLabel can look at real-time signals from your CRM, website activity, and intent data to surface useful insights right away.
That means agencies can focus on the leads most likely to convert and improve conversion rates without sitting around waiting for months of historical data to pile up.
What’s the difference between predictive lead scoring and rule-based scoring?
Rule-based scoring assigns values based on fixed criteria, like demographics or engagement actions.
Predictive lead scoring uses AI to analyze live CRM, web, and intent data to spot buyer intent and behavior patterns in real time. Instead of relying on manual logic, it dynamically prioritizes leads based on signals linked to conversion potential.
How often should a predictive lead scoring model be reviewed or retrained?
Predictive lead scoring models need regular review and retraining if you want them to stay accurate as market conditions shift and buyer behavior changes. How often you do this comes down to two things: your agency’s sales cycle and how much data you’re working with.
It also helps to validate the model against conversion metrics so it stays aligned with your ideal customer profile. With steady monitoring, your workflows can keep putting high-intent leads at the top of the pile and help your team focus its outreach where it’s most likely to pay off.